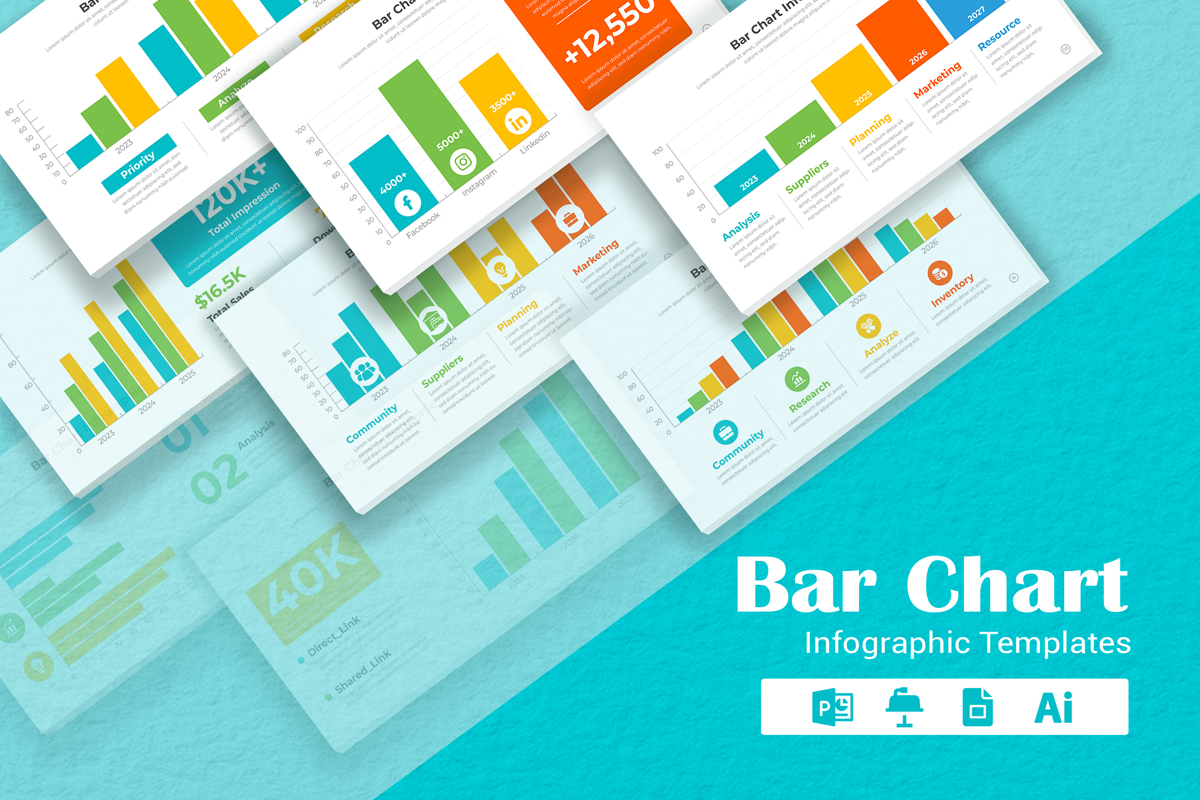
Bar Chart Infographic PowerPoint Layout


The Bar Chart Infographic PowerPoint layout is a visually compelling presentation design that effectively communicates data in a concise and engaging manner. Featuring a clean and modern aesthetic, this layout incorporates vibrant colors and clear typography to enhance readability. The bar chart elements are thoughtfully designed to represent numerical values, making complex information easily digestible for the audience. The layout is structured with precision, ensuring a logical flow of information. Each bar is meticulously labeled, and the overall design promotes a professional and polished look. This PowerPoint layout is an ideal choice for business presentations, reports, or educational purposes, seamlessly blending functionality with aesthetics.
▶ F E A T U R E
================
✔ Instant Download – your files are available immediately after purchase
✔ Professional, clean design
✔ Easy to edit in PowerPoint (PPT), Apple Keynote File, Google Slides, Illustrator (EPS) File,
✔ 100% Editable
✔ Using a free font
▶ W H A T ' S I N S I D E
===========================
✔ PowerPoint (PPT) File
✔ Apple Keynote File
✔ Google Slides
✔ Illustrator (EPS)
✔ Help File Documentation
✔ Links to free fonts used
✔ Fast and friendly customer service for any help you may need
▶ S U P P O R T
================
For any help regarding this file, please feel free to contact me and I’ll be glad to offer support. If you have a moment, please rate this item, I’ll appreciate it very much! Please don’t underestimate the power of the stars.
THANK YOU.
-
Free 24/7
Support Team -
Ready Solutions
For Business -
Premium
Quality -
1 200 000+
Satisfied Customers
| "Template #" 373240 | |
| Тип: | Infographic Elements |
| Author: | MightySlide |
| Downloads: | 0 |
| Template # 373240 |
| Type: Infographic Elements |
| Author: MightySlide |
| Downloads: 0 |
Template Software Required: Adobe Illustrator 8+, Adobe Illustrator CS2, PowerPoint 2003 or 2007 (better), Powerpoint 2007 (recommended) or Powerpoint 2003,
tags: analysis, business, colorful, communication, corporate, graph, layout, modern, presentation, professional, report, statistics, infographic, powerpoint, design elements, bar chart, data visualization, visual communication, information design, visual aid,
Topic: Design, Design & Photography,


